
19 boys turn out for playing hockey. Of these, 11 are wearing hockey shirts and 14 are wearing hockey pants. There are no boys without shirts and/or pants. What is the number of boys wearing full uniform?
UPSC CSAT 2018 Questions
30 questions from the CSAT 2018 paper with answers and detailed solutions. Pick an option to check your answer.
Comprehension passages are not included yet.
There are 24 equally spaced points lying on the circumference of a circle. What is the maximum number of equilateral triangles that can be drawn by taking sets of three points as the vertices?
A student has to get 40% marks to pass in an examination. Suppose he gets 30 marks and fails by 30 marks, then what are the maximum marks in the examination?
A winners' stand consists of three distinct wooden blocks. Six colours are available. Each block must have a different colour. In how many ways can the stand be painted?
A bag contains 15 red balls and 20 black balls. Each ball is numbered either 1 or 2 or 3. 20% of the red balls are numbered 1 and 40% of them are numbered 3. Similarly, among the black balls, 45% are numbered 2 and 30% are numbered 3. A boy picks a ball at random. He wins if the ball is red and numbered 3 or if it is black and numbered 1 or 2. What are the chances of his winning?
A shopkeeper sells an article at ₹40 and gets X% profit. However, when he sells it at ₹20, he faces the same percentage of loss. What is the original cost of the article?
Which one of the following decimal numbers is a rational number with denominator 37?
Consider the following statements:
1. Every irrational number is a real number.
2. Every real number is a rational number.
3. Every rational number is a real number.
4. Every integer is a real number.
Which of the above statements are correct?
A person bought a refrigerator for ₹22,800 at 12.5% compound interest per annum, compounded yearly. He paid ₹8,650 at the end of the first year and ₹9,125 at the end of the second year. How much should he pay at the end of the third year to completely clear the debt?
Options:
If X is between -3 and -1, and Y is between -1 and 1, then X^2 - Y^2 is in between which of the following?
Two persons run on a circular track. B initially leads A by an angular separation of 30°. When A reaches the point diametrically opposite his starting point, he meets B. Find the ratio of their speeds.
Consider the sequence given below: 4/12/95, 1/1/96, 29/1/96, 26/2/96, what is the next term of the series?
If RAMON is written as 12345 and DINESH as 675849, then HAMAM will be written as
If LSJXVC is the code for MUMBAI, the code for DELHI is
Directions for the following 3 (three) items:
Rotated positions of a single solid are shown below. The various faces of the solid are marked with different symbols like dots, cross and line. Answer the three items that follow the given figures.
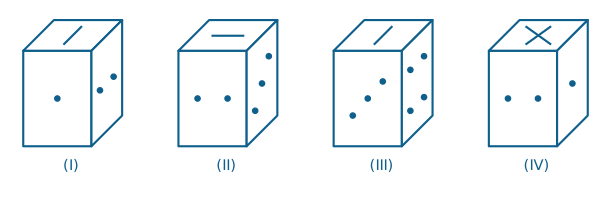
What is the symbol on the face opposite to that containing a single dot?
Directions for the following 3 (three) items:
Rotated positions of a single solid are shown below. The various faces of the solid are marked with different symbols like dots, cross and line. Answer the three items that follow the given figures.
What is the symbol on the face opposite to that containing two dots?
Directions for the following 3 (three) items:
Rotated positions of a single solid are shown below. The various faces of the solid are marked with different symbols like dots, cross and line. Answer the three items that follow the given figures.
What is the symbol on the face opposite to that containing the cross?
A solid cube of 3 cm side, painted on all its faces, is cut up into small cubes of 1 cm side. How many of the small cubes will have exactly two painted faces?
Directions for the following 3 (three) items:
The following three items are based on the graph given below which shows imports of three different types of steel over a period of six months of a year. Study the graph and answer the three items that follow.
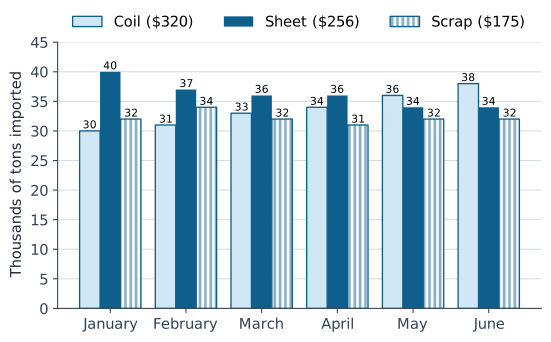
The figures in the brackets indicate the average cost per ton over six months period.
By how much (measured in thousands of tons) did the import of sheet steel exceed the import of coil steel in the first three months of the year?
Directions for the following 3 (three) items:
The following three items are based on the graph given below which shows imports of three different types of steel over a period of six months of a year. Study the graph and answer the three items that follow.
The figures in the brackets indicate the average cost per ton over six months period.
What was the approximate total value (in $) of sheet steel imported over the six months period?
Directions for the following 3 (three) items:
The following three items are based on the graph given below which shows imports of three different types of steel over a period of six months of a year. Study the graph and answer the three items that follow.
The figures in the brackets indicate the average cost per ton over six months period.
What was the approximate ratio of sheet steel and scrap steel imports in the first three months of the year?
Consider the following graph:
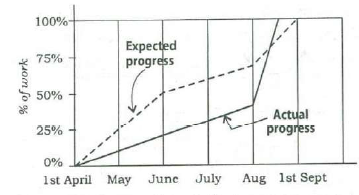
Which one of the following statements is not correct with reference to the graph given above?
Directions for the following 2 (two) items:
Consider the following graph in which the birth rate and death rate of a country are given, and answer the two items that follow.
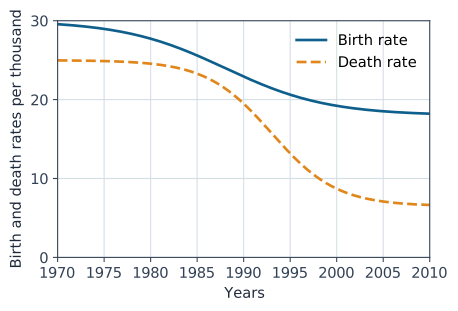
Looking at the graph, it can be inferred that from 1990 to 2010
Directions for the following 2 (two) items:
Consider the following graph in which the birth rate and death rate of a country are given, and answer the two items that follow.
With reference to the above graph, consider the following statements considering 1970 as base year:
1. Population has stabilized after 35 years.
2. Population growth rate has stabilized after 35 years.
3. Death rate has fallen by 10% in the first 10 years.
4. Birth rate has stabilized after 35 years.
Which of the above are the most logical and rational statements that can be made from the above graph?
Average hourly earnings per year (E) of the workers in a firm are represented in figures A and B as follows:
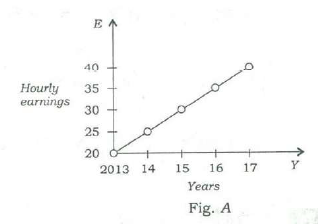
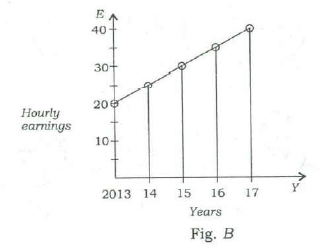
From the figures, it is observed that the
The manufacturing cost and projected sales for a product are shown in the above figures A and B respectively. What is the minimum number of pieces that should be manufactured to avoid a loss?
Consider the following graphs. The curves in the graphs indicate different age groups in the populations of two countries A and B over a period of few decades:
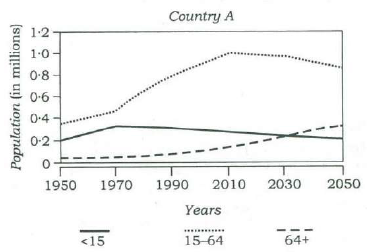
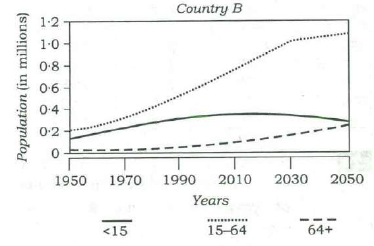
With reference to the above graphs, which of the following are the most logical and rational inferences that can be made?
1. Over the last two and a half decades, the dependency ratio for country B has decreased.
2. By the end of next two and a half decades, the dependency ratio of country A will be much less than that of country B.
3. In the next two decades, the work-force relative to its total population will increase in country B as compared to country A.
Select the correct answer using the code given below:
The graph given below indicates the changes in key policy rates made by Central Bank several times in a year:
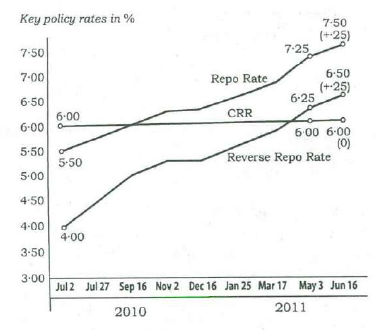
Which one of the following can be the most likely reason for the Central Bank for such an action?
The following graph indicates the composition of our tax revenue for a period of two decades:
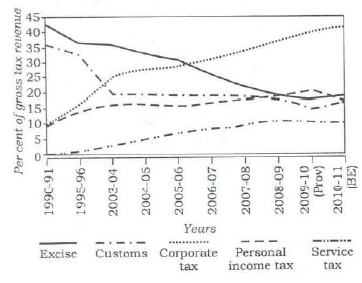
With reference to the above graph, which of the following is/are the most logical and rational inference/inferences that can be made?
1. During the given period, the revenue from Direct Taxes as percentage of gross tax revenue has increased while that of Indirect Taxes decreased.
2. The trend in the revenue from Excise Duty demonstrates that the growth of manufacturing sector has been negative during the given period.
Select the correct answer using the code given below.
Consider the following pattern of numbers:
8 10 15 13
6 5 7 4
4 6 8 8
_ _ _ _
6 11 16 ?
What is the number at? in the above pattern?