
If LSJXVC is the code for MUMBAI, the code for DELHI is
UPSC CSAT Previous Year Questions
Filter by topic or year, pick an answer to check it instantly, and read the step-by-step solution.
491Questions
61Topics
2011–2026Papers
All questions
491 questions · page 16 of 33
Directions for the following 3 (three) items:
Rotated positions of a single solid are shown below. The various faces of the solid are marked with different symbols like dots, cross and line. Answer the three items that follow the given figures.
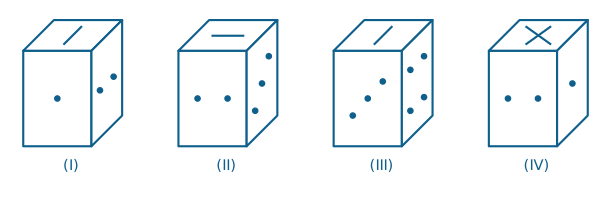
What is the symbol on the face opposite to that containing a single dot?
Directions for the following 3 (three) items:
Rotated positions of a single solid are shown below. The various faces of the solid are marked with different symbols like dots, cross and line. Answer the three items that follow the given figures.
What is the symbol on the face opposite to that containing two dots?
Directions for the following 3 (three) items:
Rotated positions of a single solid are shown below. The various faces of the solid are marked with different symbols like dots, cross and line. Answer the three items that follow the given figures.
What is the symbol on the face opposite to that containing the cross?
A solid cube of 3 cm side, painted on all its faces, is cut up into small cubes of 1 cm side. How many of the small cubes will have exactly two painted faces?
Directions for the following 3 (three) items:
The following three items are based on the graph given below which shows imports of three different types of steel over a period of six months of a year. Study the graph and answer the three items that follow.
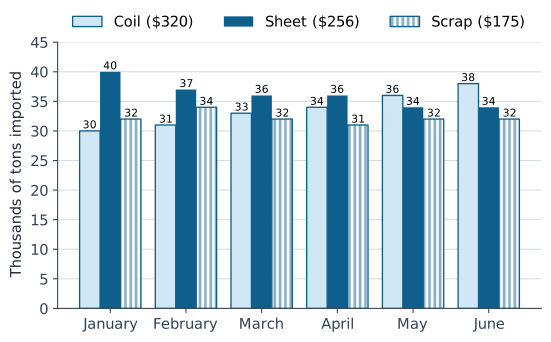
The figures in the brackets indicate the average cost per ton over six months period.
By how much (measured in thousands of tons) did the import of sheet steel exceed the import of coil steel in the first three months of the year?
Directions for the following 3 (three) items:
The following three items are based on the graph given below which shows imports of three different types of steel over a period of six months of a year. Study the graph and answer the three items that follow.
The figures in the brackets indicate the average cost per ton over six months period.
What was the approximate total value (in $) of sheet steel imported over the six months period?
Directions for the following 3 (three) items:
The following three items are based on the graph given below which shows imports of three different types of steel over a period of six months of a year. Study the graph and answer the three items that follow.
The figures in the brackets indicate the average cost per ton over six months period.
What was the approximate ratio of sheet steel and scrap steel imports in the first three months of the year?
Consider the following graph:
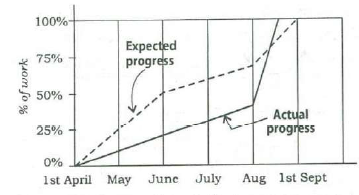
Which one of the following statements is not correct with reference to the graph given above?
Directions for the following 2 (two) items:
Consider the following graph in which the birth rate and death rate of a country are given, and answer the two items that follow.
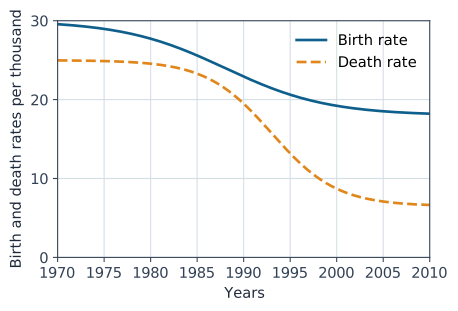
Looking at the graph, it can be inferred that from 1990 to 2010
Directions for the following 2 (two) items:
Consider the following graph in which the birth rate and death rate of a country are given, and answer the two items that follow.
With reference to the above graph, consider the following statements considering 1970 as base year:
1. Population has stabilized after 35 years.
2. Population growth rate has stabilized after 35 years.
3. Death rate has fallen by 10% in the first 10 years.
4. Birth rate has stabilized after 35 years.
Which of the above are the most logical and rational statements that can be made from the above graph?
Average hourly earnings per year (E) of the workers in a firm are represented in figures A and B as follows:
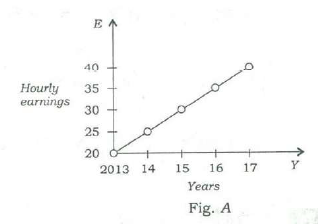
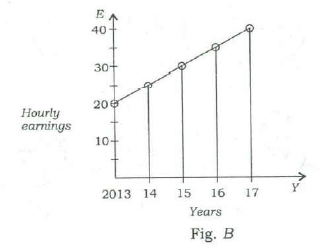
From the figures, it is observed that the
The manufacturing cost and projected sales for a product are shown in the above figures A and B respectively. What is the minimum number of pieces that should be manufactured to avoid a loss?
Consider the following graphs. The curves in the graphs indicate different age groups in the populations of two countries A and B over a period of few decades:
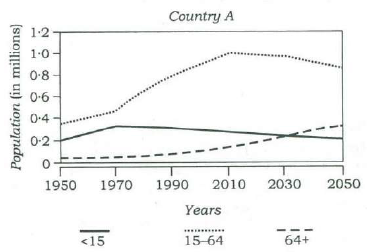
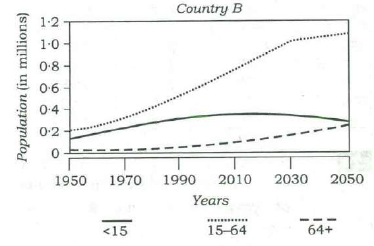
With reference to the above graphs, which of the following are the most logical and rational inferences that can be made?
1. Over the last two and a half decades, the dependency ratio for country B has decreased.
2. By the end of next two and a half decades, the dependency ratio of country A will be much less than that of country B.
3. In the next two decades, the work-force relative to its total population will increase in country B as compared to country A.
Select the correct answer using the code given below:
The graph given below indicates the changes in key policy rates made by Central Bank several times in a year:
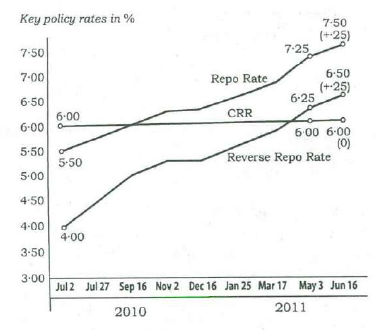
Which one of the following can be the most likely reason for the Central Bank for such an action?
Year-wise CSAT papers
Topic-wise CSAT PYQs
Maths
Basic Numeracy
Arithmetic
Applied Arithmetic
Algebra & Advanced Topics
Geometry & Mensuration
Statistics
Reasoning
Core Reasoning
Verbal & Logical Relations
Arrangement & Puzzle
Series & Patterns
Data Interpretation & Sufficiency
Logical Statements
Want guided practice with timed tests and doubt clearing?