
If 'A x B' means A is the brother of B; 'A / B' means A is the father of B and 'A + B' means A is the sister of B, which of the following means M is the uncle of P?
UPSC CSAT Previous Year Questions
Filter by topic or year, pick an answer to check it instantly, and read the step-by-step solution.
491Questions
61Topics
2011–2026Papers
All questions
491 questions · page 30 of 33
A, B, C, D and E are members of the same family. There are two fathers, two sons, two wives three males and two females. The teacher was the wife of a lawyer who was the son of a doctor. E is not a male, neither also a wife of a professional. C is the youngest person in the family and D is the eldest. B is a male.
How is D related to E?
A, B, C, D and E are members of the same family. There are two fathers, two sons, two wives three males and two females. The teacher was the wife of a lawyer who was the son of a doctor. E is not a male, neither also a wife of a professional. C is the youngest person in the family and D is the eldest. B is a male.
Who are the females in the group?
A, B, C, D and E are members of the same family. There are two fathers, two sons, two wives three males and two females. The teacher was the wife of a lawyer who was the son of a doctor. E is not a male, neither also a wife of a professional. C is the youngest person in the family and D is the eldest. B is a male.
Whose wife is the teacher?
Consider the four age pyramids given below namely A, B, C and D representing four different countries.
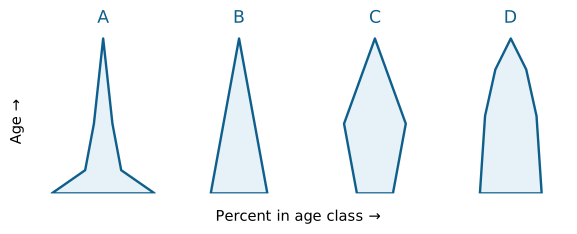
Which one of them indicates the declining population?
The following figure has four curves namely A, B, C and D. Study the figure and answer the item that follows.
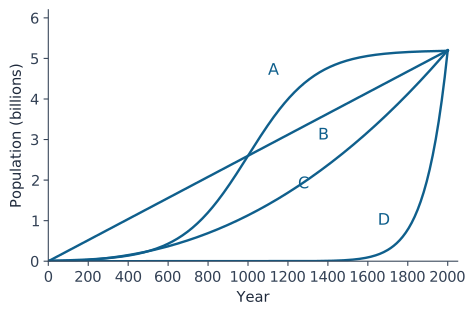
Which curve indicates the exponential growth?
Directions for the following 2 (two) items:
The following pie-charts show the break-up of disease categories recorded in the patients from two towns, Town A and Town B. Pie-charts plot the disease categories as percentage of the total number of patients. Based on these, answer the two items that follow the charts.
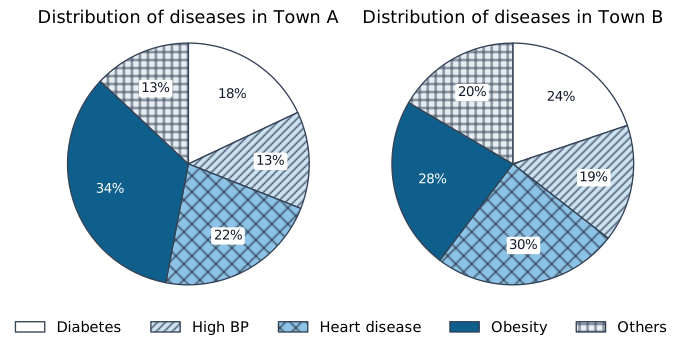
Which of the two towns has a higher number of persons with Diabetes?
Directions for the following 2 (two) items:
The following pie-charts show the break-up of disease categories recorded in the patients from two towns, Town A and Town B. Pie-charts plot the disease categories as percentage of the total number of patients. Based on these, answer the two items that follow the charts.
What can we say about persons with more than one disease from these graphs?
Consider the following Velocity-Time graph. It shows two trains starting simultaneously on parallel tracks.
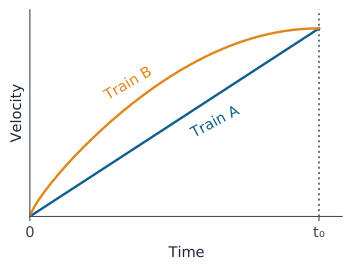
With reference to the above graph, which one of the following statements is not correct?
Consider the following distance-time graph. The graph shows three athletes A, B, and C running side by side for a 30 km race.
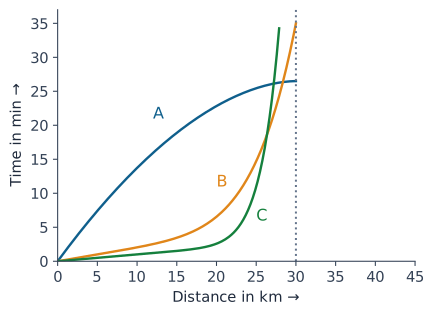
With reference to the above graph, consider the following statements:
1. The race was won by A.
2. B was ahead of A up to 25 km mark.
3. C ran very slowly from the beginning.
Which of the statements given above is/are correct?
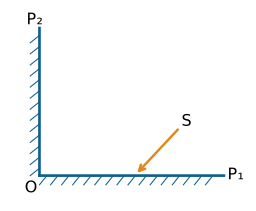
Consider the figure given below and answer the items that follows: In the figure shown above, OP 1 and OP2 are two plane mirrors kept perpendicular to each other. S is the direction of a beam of light falIing on the mirror OP1. The direction of the reflected beam of light from the mirror OP2 will be
Directions for the following 3 (three) items:
Read the passage given below, study the graph that follows and answer the three items given below the figure.
During a party, a person was exposed to contaminated water. A few days later, he developed fever and loose motions. He suffered for some days before going to a doctor for treatment. On starting the treatment, he soon became better and recovered completely a few days later. The following graph shows different phases of the person's disease condition as regions A, B, C, D and E of the curve
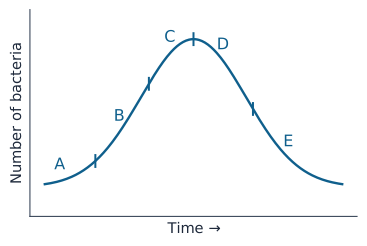
Which region/regions of the curve correspond/corresponds to incubation phase of the infection?
Directions for the following 3 (three) items:
Read the passage given below, study the graph that follows and answer the three items given below the figure.
During a party, a person was exposed to contaminated water. A few days later, he developed fever and loose motions. He suffered for some days before going to a doctor for treatment. On starting the treatment, he soon became better and recovered completely a few days later. The following graph shows different phases of the person's disease condition as regions A, B, C, D and E of the curve
Which region of the curve indicates that the person began showing the symptoms of infection?
Directions for the following 3 (three) items:
Read the passage given below, study the graph that follows and answer the three items given below the figure.
During a party, a person was exposed to contaminated water. A few days later, he developed fever and loose motions. He suffered for some days before going to a doctor for treatment. On starting the treatment, he soon became better and recovered completely a few days later. The following graph shows different phases of the person's disease condition as regions A, B, C, D and E of the curve
Which region of the curve indicates that the treatment yielded effective relief?
You are asked to explain why you did not attend an important official meeting. Your immediate superior had not informed you about the meeting but is now pressuring you not to mention this fact.
What would you do?
Year-wise CSAT papers
Topic-wise CSAT PYQs
Maths
Basic Numeracy
Arithmetic
Applied Arithmetic
Algebra & Advanced Topics
Geometry & Mensuration
Statistics
Reasoning
Core Reasoning
Verbal & Logical Relations
Arrangement & Puzzle
Series & Patterns
Data Interpretation & Sufficiency
Logical Statements
Want guided practice with timed tests and doubt clearing?